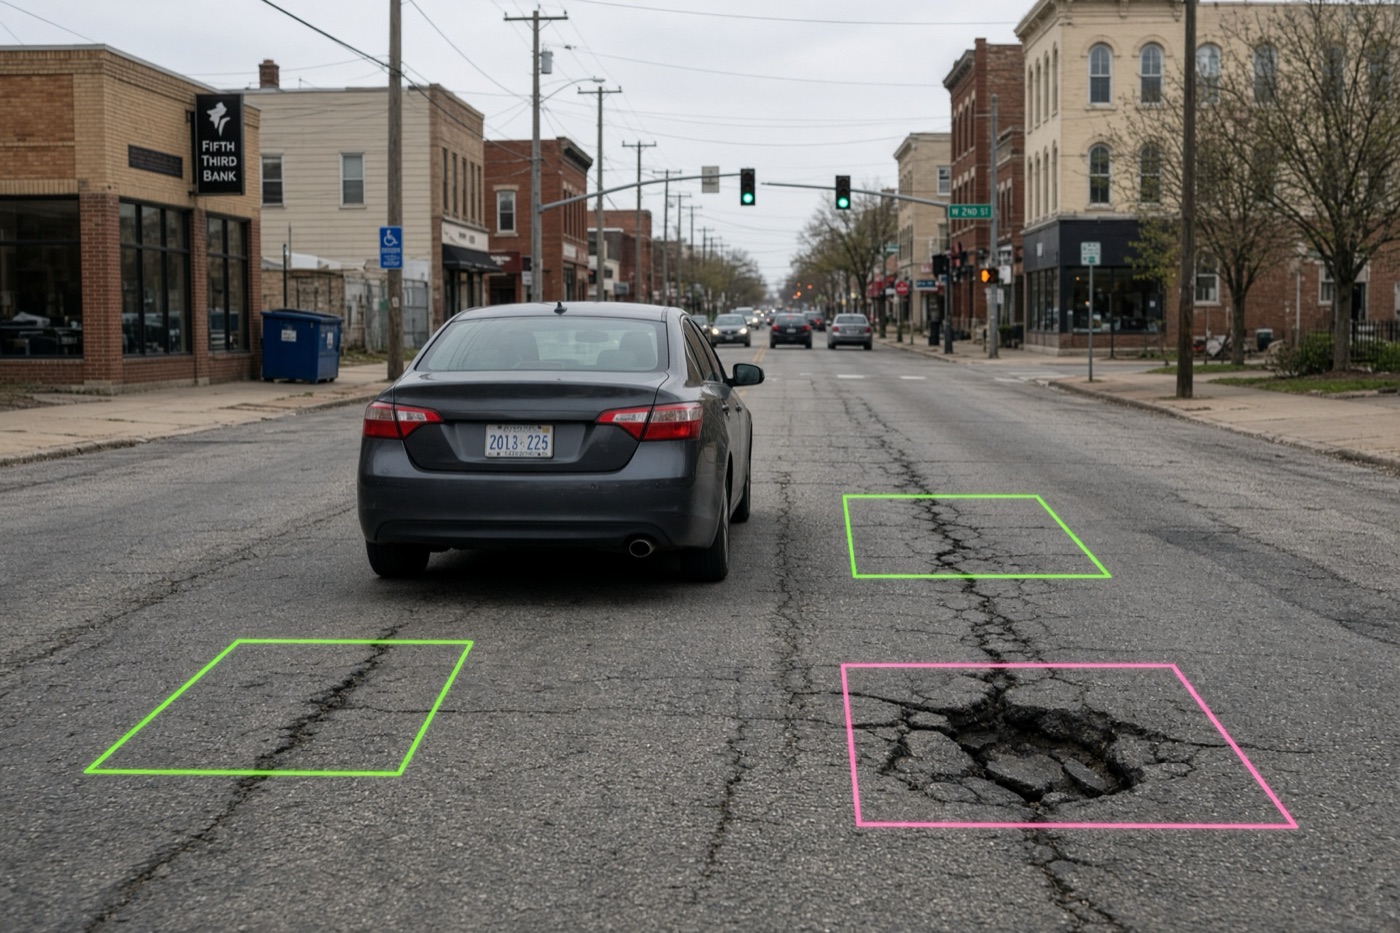
Most cities start looking at automated roadway inventory options for one of three reasons. The council has asked for a pavement condition index (PCI) on every street. A vendor renewal is coming up. Or the city used RoadBotics, which shut down last year.
We sell one of the options below, so keep that in mind. We also talk with city engineers and public works directors every week, and many of them have already tried one of these products. This guide pulls together what they’ve told us, along with what we found in public contracts and council records.
The four ways cities collect road condition data today
Nearly every pavement condition survey product on the market is a version of one of these:
- A phone on the windshield, driven by your staff (Vialytics).
- Crowdsourced dashcam footage bought from fleets already on the road (Blyncsy).
- A laser or LiDAR survey van driven by the vendor (RAS, Cyvl, Citylogix).
- A dedicated camera on a city vehicle, driven by you, by the vendor, or mounted permanently on garbage trucks and street sweepers (Placemetry).
A fifth option, the phone-based RoadBotics, shut down at the end of 2025. We cover what that means for former customers below.
| How data is collected | How it’s priced | Usually a good fit for | |
|---|---|---|---|
| Vialytics | Smartphone on the windshield of a city vehicle, driven by city staff | Annual subscription plus a setup fee | Cities that want staff-driven monitoring and a work-order platform in one |
| Blyncsy (Bentley Systems) | Dashcam imagery bought from commercial fleets; the city drives nothing | Per mile, per image collection, plus per-mile fees for each detection type | DOTs and large agencies that want a fast, low-effort overview |
| Laser and LiDAR vans (RAS, Cyvl, Citylogix) | Vendor-driven vehicle with lasers or LiDAR plus a 360° camera | Engineering or multi-year services contract, often re-bid every few years | Cities that need survey-grade measurements, a 3D model of the right-of-way, or an engineer-led plan |
| Placemetry | Roof-mounted GPS camera: you drive (DIY Roadways), we drive (City Snapshot), or it rides on garbage trucks and street sweepers (City Stream) | Per centerline mile with no subscription (DIY Roadways, City Snapshot); per vehicle outfitted (City Stream) | Cities that want to own their data and choose between one-time and continuous coverage |
A three-question checklist for comparing vendors
Every vendor can show you a map of red, yellow and green streets. When cities tell us what they wish they had checked before signing, it usually comes back to three questions.
Is it cost-effective over the long run? Look at five years, not the first invoice. Include renewals, add-ons, staff time spent driving and the next survey.
Is it objective? If you drove the same street twice, would you get the same score? Or does it change with the device and the weather that day? This matters most when you need to look at changes over time.
Is it up to date? Can you see what a street looks like this month, or are you working from a survey that’s two years old?
Here’s how we’d rate each one ( strong, partial or depends, weak). None of them, ours included, is strong on all three in every setup.
| Cost-effective | Objective | Up to date | |
|---|---|---|---|
| Vialytics | Low entry price, but it’s an annual subscription and staff do the driving | Consistent AI, but phone images vary with glare, weather, speed and mounting | As often as staff are willing to drive |
| Blyncsy | Low per-mile price and no driving | Footage comes from many dashcams the city doesn’t control | Frequent on busy roads, thin on quiet residential streets |
| Laser and LiDAR vans (RAS, Cyvl, Citylogix) | Six-figure contracts are common | Calibrated sensors and a standard protocol | Too expensive to repeat often; many cities get new data every 3 to 5 years |
| Placemetry | Per-mile or per-vehicle pricing with no subscription, license or storage fees; DIY Roadways is the lowest-cost option | The same purpose-built camera on every drive, checked against cities’ own manual ratings | Three cadences: the city drives (DIY Roadways), we drive (City Snapshot), or cameras stay on city vehicles for continuous and on-demand coverage (City Stream) |
What city staff keep telling us
They care about consistency more than the demo. A Tennessee city preparing a competitive bid had already looked at five or six vendors before it called us. Staff wanted to know whether a street would score the same on two passes and from one year to the next. They had seen shadows read as cracks and PCI scores that changed day to day. They also wanted to know if the AI-generated PCI score would compare well to their manual surveys.
They want to own their data. One city had used a subscription platform for years and didn’t want to keep paying in years when it collected no new data. Staff told us they wanted to own their data and stop paying every year to keep access to it.
They want more frequent coverage. A Missouri public works director comparing us with Vialytics told us our price was a little lower, but “you only do the drive once where Vialytics allows us to drive as much as we want.” He had a point, and it’s part of why we built City Stream.
Big cities want something between laser surveys. Several large cities we’ve talked with already pay for laser or LiDAR surveys. They aren’t looking to replace them. They want a lower-cost way to keep tabs on their streets in the years between those expensive runs.
Vialytics: a smartphone on the windshield
Vialytics is the name we hear most often. A phone mounted on the windshield of a city vehicle takes a geotagged photo every 10 to 12 feet as staff drive their usual routes. AI flags pavement damage (Vialytics lists 15 standard damage types) and logs assets like signs, manholes and storm drains. Everything lands in the Vialytics web platform, which also handles inspections, work orders and capital planning.
What it costs. Quote-based annual subscriptions. For a sense of scale, one Wisconsin city approved a three-year agreement in 2026 at $9,300 a year plus a $4,750 setup fee.
What we hear. A Utah city engineer told us they’d signed with Vialytics a few months earlier and had just finished their first PCI analysis.
Why a phone appeals. It’s cheap to start and easy to run: mount it, open the app, drive. There’s no survey crew and no special vehicle. Because your own staff collect the data, you can re-check a neighborhood after a storm without signing a new contract. And having condition data and work orders in one place is convenient.
Where a phone falls short. A phone behind the windshield sits low and looks through glass, so it sees less of the street, sidewalk and signs than a roof-mounted camera. Vialytics ships a matte dashboard cover to cut down on glare. Sun angle, rain, dusk, a dirty windshield and vehicle speed all change the image. Vialytics’ own bid documents say photos are captured below 38 mph, and the company has said publicly that its AI has to deal with “reflections, wet roads, blurry images.” Phones also overheat on hot dashboards and shut off mid-route, enough that Vialytics’ help center has an article on it. In a southern summer, that can mean missed streets and repeat drives. Coverage is only as complete as the routes staff actually drive. And under Vialytics’ terms, access to the platform ends when the subscription does, so plan to export your ratings and images before a contract lapses.
Good fit if you want staff-driven monitoring and an all-in-one maintenance platform, and an ongoing subscription works for your budget.
Blyncsy: crowdsourced dashcam footage
With Blyncsy, the city doesn’t drive at all. The company buys dashcam footage from fleets that are already on the road (more than a million vehicles, it says) and runs AI over it to find more than 40 conditions and assets, from potholes and cracking to striping, signs, guardrails and streetlights. Blyncsy is now part of Bentley Systems, the infrastructure software company; its imagery product was originally sold as Payver.
What it costs. Per centerline mile, per collection (a “pull”). Bentley advertises pricing from $8 a mile. Blyncsy’s response to the Texas TXShare cooperative bid listed $10 a mile per pull, plus about $0.25 a mile for each detection type you add, such as PCI, potholes or sign inventory.
What we hear. An Arizona city that had used Blyncsy told us it wasn’t satisfied with the quality of the images or the detections, and it switched to Placemetry. The Tennessee city above also included Blyncsy in its evaluation. Blyncsy has public projects with Fort Worth, Plano and several state DOTs.
Why it appeals. The city doesn’t spend staff time or buy hardware, and a large network can be covered quickly. State DOTs with thousands of highway miles use it for that reason, and the per-mile price is low for a first look.
Questions to ask about crowdsourced data. You only get imagery where the contributing fleets happen to drive. Highways and arterials show up often. Cul-de-sacs, alleys and quiet residential streets, which make up most of a city’s lane miles, may show up rarely. Ask for a street-by-street coverage map and the share of segments imaged in the last 90 days. The footage also comes from many different dashcams at different heights, resolutions and speeds, through windshields the city doesn’t clean. Fine cracking is hard to see in that kind of video, so ask how the PCI scores compare with a manual survey on your own streets. If this year’s score for a street came from a different truck and camera than last year’s, a change in score may reflect the camera, not the road. Finally, price the full deliverable: the base rate covers the footage, and each detection type is extra.
Good fit if you manage a large highway network and want a fast, low-effort overview, and you can accept less control over when and how images are captured.
Laser and LiDAR survey vans: RAS, Cyvl and Citylogix
These companies send their own sensor-equipped vehicle down every street. The main differences are the sensors on the vehicle and the software you get afterward.
RAS (Roadway Asset Services) is an engineering firm based in Austin, Texas. It drives your streets in a dedicated survey vehicle with a downward-facing laser crack measurement system (LCMS-2) that captures 3D images of the whole lane, a 32 MP 360° camera for right-of-way assets, and a certified Class I profiler that measures ride roughness (IRI). Ratings usually follow the ASTM D6433 PCI standard, and RAS engineers can turn the results into a pavement management plan with budget scenarios.
Cyvl uses vehicle-mounted LiDAR and 360° imagery to build a detailed 3D model of roads, sidewalks and right-of-way assets.
Citylogix (formerly StreetScan) drives a LiDAR and 360° camera vehicle through your network, rates pavement and can add sidewalks, ADA ramps and signs. Results go into its Streetlogix asset management software, and it typically re-surveys every three years.
What it costs. RAS works under engineering services contracts, often procured through a request for qualifications. Cyvl and Citylogix usually sell multi-year contracts that bundle data collection with their software. Public records for RAS give a sense of scale: Ennis, Texas approved $147,205 in 2023 for an assessment and pavement management system covering about 125 centerline miles. Oro Valley, Arizona is paying $91,468 for a 2026 survey. Austin approved a three-year data collection contract of up to $459,000 for its much larger network.
What we hear. Another Arizona city told us it had just hired RAS and puts the work out to bid every three years, so its next fresh look at its roads is three years away. Because of the cost, it paid only for PCI. The street sign add-on would have nearly doubled the per-mile price.
Why it appeals. Lasers and LiDAR measure the road surface directly instead of inferring everything from photos. If you need engineering-grade measurements such as rutting and roughness (IRI), or a 3D model of your right-of-way, this is the most rigorous category here.
Where it falls short. Cost, mainly. Six-figure contracts are common even for mid-sized cities, so most can only afford a survey every 3 to 5 years, and the data ages in between. That gap is why some large cities pair a laser or LiDAR survey with a cheaper camera-based check in the off years.
Good fit if you need survey-grade measurements and an engineer-led plan, and you have budget for a periodic professional survey.
What happened to RoadBotics?
RoadBotics, the Pittsburgh startup that made phone-based road ratings popular, was bought by Michelin in 2022 and renamed Michelin Better Roads. In 2025 Michelin announced it would shut down Better Roads by the end of the year and stopped taking new projects.
An Illinois village we spoke with had used RoadBotics for assessments in both 2019 and 2023. Its experience is a good reason to keep your own copy of your data. If your condition history lives only in a vendor’s platform, a shutdown can mean starting over.
If you’re a former RoadBotics customer, the main choice is whether to stay with a phone-based subscription or move to higher-resolution imagery.
Former RoadBotics customer? Talk to us about a free pilot assessment of one of your neighborhoods, and compare it side by side with your last RoadBotics report.
Placemetry: one camera, three ways to use it
Placemetry started as a university research spin-out; our founders are professors, and our AI models build on published academic research. We built it around two ideas. A single drive should be useful to more than the streets department, and the data should belong to the city.
All three options use the same roof-mounted, GPS-tagged camera, which sees more of the street than a phone behind the windshield. It’s a ruggedized camera rated for extreme weather, so it keeps recording through summer heat and winter cold instead of shutting down the way a phone on a hot dashboard can. Each includes segment-level PCI scores, photos of each distress, color-coded maps, a prioritized repair list and a pavement management plan. Faces and license plates are blurred before processing. You keep all of it, with no subscription, user license or storage fees.
DIY Roadways: you drive. We mail you a camera and mounting kit. You put it on the roof of any city vehicle, drive your streets and mail it back. It’s our simplest and lowest-cost option, at about $99 per centerline mile with no subscription or startup costs. It works well for smaller cities, a first baseline, and state-required ratings like PASER or PCI. DIY Roadways focuses on pavement today. We regularly update our technology and hope to offer additional detections soon.
City Snapshot: we drive. Our team drives your network. On top of pavement, the higher-resolution capture adds a citywide asset inventory: signs, lane markings, crosswalks, sidewalk condition and trees, plus side-facing imagery that code enforcement teams use to spot vacant properties, illegal dumping and overgrown lots. City Snapshot starts at about $200 per centerline mile, depending on which detections you choose.
City Stream: always on. We mount cameras on garbage trucks and street sweepers, which already cover every street on their regular routes. You can pull up current conditions whenever you need them, and nobody has to change a route or schedule a drive. City Stream runs roughly $30,000 to $60,000 per vehicle outfitted. As a rough guide, a city with about 1,000 centerline miles might outfit 2 to 4 street sweepers, or up to 10 code enforcement vehicles.
Results are available in our web app, as spreadsheet downloads, through a REST API and webhooks, and through native Esri ArcGIS and Cityworks integrations.
How we hold up on the checklist.
- Cost-effective: you pay per centerline mile or per vehicle, and the data is yours to keep.
- Objective: the same purpose-built, weather-rated camera on every drive, not whatever phone or dashcam was available. We’ve tested our ratings against manual surveys in several Midwest cities. In one city, we compared our scores with its inspectors’ 2025 PASER ratings on 276 street segments: 59% of our ratings were within 1 point of the city’s, 90% were within 2 points, and our scores averaged 0.6 points lower, so slightly more conservative than the city’s own.
- Up to date: City Stream gives continuous, on-demand coverage. If you don’t need that, DIY Roadways and City Snapshot let you re-survey whenever you choose, without a multi-year contract.
When we’re not the right choice. If your engineers need laser-measured rutting and roughness (IRI), a survey firm like RAS is the better tool. If your main goal is a highway-scale overview with zero city involvement, crowdsourced footage may be enough.
Other names you’ll hear
You may also come across these companies:
- Xweather RoadAI (Vaisala): phone video from city vehicles, analyzed in the cloud. A natural fit for agencies already using Vaisala’s road weather tools.
- GoodRoads: a North Carolina company that provides portable cameras for city vehicles and produces multi-year pavement management plans.
- CityRover: a Canadian company whose smart camera mounts on street sweepers and patrol vehicles to flag potholes and other hazards between formal surveys.
The same three questions from the checklist apply to all of them.
Which option fits your situation?
- “We need a baseline PCI on a tight budget.” A one-time, per-mile survey (DIY Roadways or City Snapshot) or a phone-based subscription. Compare the five-year cost, not the first year.
- “We want to see conditions year-round without adding work for staff.” Cameras on vehicles that already cover every street (City Stream), or crowdsourced footage if your network is mostly highways and arterials.
- “Our engineers need survey-grade measurements.” A laser or LiDAR survey vendor such as RAS, Cyvl or Citylogix.
- “We already do laser surveys but need data in between.” A lower-cost camera survey in the off years, or City Stream for ongoing coverage, so you aren’t waiting three to five years for the next run.
- “We were on RoadBotics.” Start by exporting everything you still have. Then run a pilot on a neighborhood you know well and compare it with your last report.
- “Several departments want the data.” Look for imagery that also covers signs, sidewalks and property conditions, so streets, code enforcement and planning can all use the same drive.
Questions to ask every vendor (including us)
- What will we pay in total over five years, including renewals, add-ons, storage and staff driving time?
- Can you show repeat-run results on the same streets, and a comparison with a manual survey? How much did the scores move?
- How current is the data on our quietest residential street, and how do we refresh it?
- Who owns the images and detections, and can we export everything in a standard format if we leave or you shut down?
- Can you use our images to train your AI, and does that continue after we leave?
- Will the results load into our pavement management system (StreetSaver, Cityworks, ArcGIS, OpenGov)?
- Which assets beyond pavement are included, and how do you check detection quality?
- Are you on a cooperative purchasing contract, or will we need to run an RFP?
Frequently asked questions
How much does a pavement condition survey cost?
It depends heavily on the method. Public contracts show phone-based subscriptions around $9,000 to $10,000 a year for a small city, crowdsourced imagery from about $8 to $10 a mile per collection plus add-ons, and laser-van engineering surveys from roughly $90,000 to $150,000 for a smaller city’s network. Placemetry’s DIY Roadways starts around $99 per centerline mile and City Snapshot around $200, with no subscription. City Stream runs roughly $30,000 to $60,000 per vehicle outfitted.
Is a smartphone good enough for pavement ratings?
It’s a cheap, easy way to start, and being able to drive often is valuable. The trade-off is image quality and consistency: a phone behind the windshield sees less of the street, is affected by glare, weather, speed and mounting, and can overheat and shut off on hot days. If you rely on year-over-year trends, ask for repeat-run results.
Is crowdsourced road imagery reliable?
It’s useful for a fast, broad overview, especially on highways. For a city network, check coverage street by street, particularly on low-traffic residential streets, and ask how scores from mixed dashcam footage compare with a manual survey on your roads.
Do we need lasers or LiDAR for an accurate PCI?
Not necessarily. High-resolution imagery with well-trained AI can produce reliable segment-level PCI, as our comparison with one city’s manual ratings shows. Lasers add precise measurements of rutting and roughness, which some engineering work needs, but they’re expensive and most cities can only afford them every few years.
What’s the best alternative to Vialytics?
It depends on why you’re looking. If you want to stop paying a subscription and own your data, a one-time model like Placemetry’s DIY Roadways or City Snapshot fits. If you want continuous coverage without asking staff to drive, City Stream puts cameras on vehicles that already cover every street. If you need survey-grade laser or LiDAR measurements, look at RAS, Cyvl or Citylogix.
What replaced RoadBotics?
Michelin shut down Better Roads (formerly RoadBotics) at the end of 2025. Most former customers have moved to other phone-based platforms or to imagery-based services like Placemetry.
Want to see your own streets? Book a 20-minute call and ask about a free pilot assessment of one of your neighborhoods.
Sources: vendor websites and published materials (Vialytics, Bentley Systems/Blyncsy, Roadway Asset Services, Cyvl, Citylogix, Vaisala, GoodRoads, CityRover); Vialytics’ general terms and conditions, 2024 TXShare proposal and help center; Blyncsy’s TXShare price response; public city council records (Milton, WI; Ennis, TX; Austin, TX); Tucson Local Media (Oro Valley, AZ); Michelin Mobility Intelligence. Information current as of October 2026. Vendors: if anything here is out of date, email us and we’ll correct it.